#TidyTuesday #1 - US PhDs by Field
This week, the dataset is US PhDs granted by field over the years 2008 to 2017. This is a pretty simple dataset, so I’ve given myself just two hours to explore the data and then write something up. Side note - RMarkdown is awesome!
The data is simple enough, here’s a sample:
| broad_field | major_field | field | year | n_phds |
|---|---|---|---|---|
| Life sciences | Agricultural sciences and natural resources | Agricultural economics | 2008-01-01 | 111 |
| Life sciences | Agricultural sciences and natural resources | Agricultural and horticultural plant breeding | 2008-01-01 | 28 |
| Life sciences | Agricultural sciences and natural resources | Agricultural animal breeding | 2008-01-01 | 3 |
| Life sciences | Agricultural sciences and natural resources | Agronomy and crop science | 2008-01-01 | 68 |
| Life sciences | Agricultural sciences and natural resources | Animal nutrition | 2008-01-01 | 41 |
| Life sciences | Agricultural sciences and natural resources | Animal science, poultry or avian | 2008-01-01 | 18 |
So we have the field of study at 3 increasingly specific levels, a year, and the number of awarded PhDs at the most specific level. Summarizing the data is going to be key here!
PhDs awarded per year
Let’s start by looking at the yearly data, and seeing if there’s any trends:
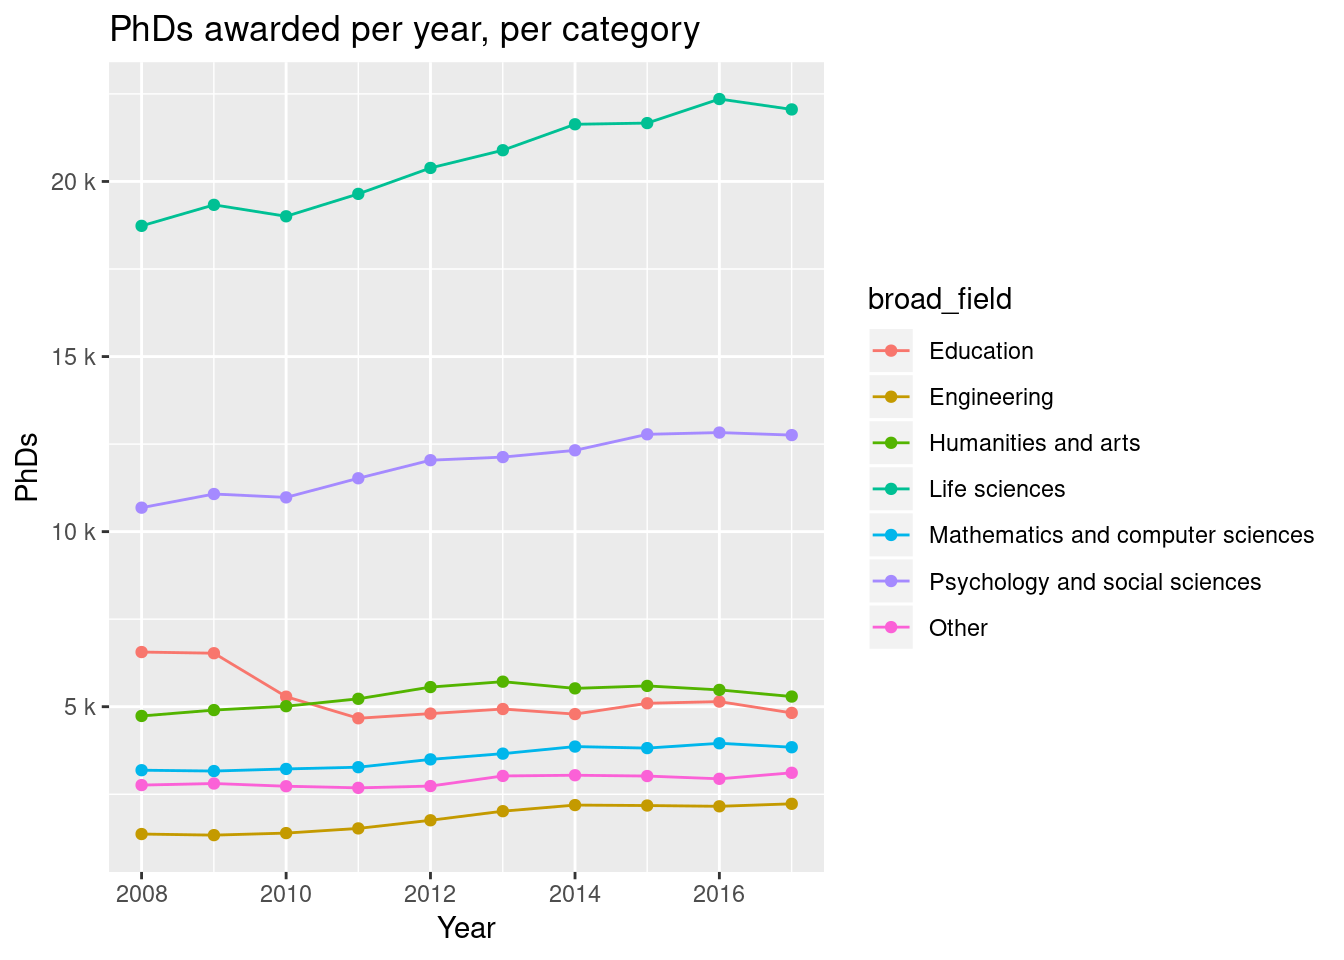
Nothing huge here, I feel - Life Sciences and Pschology on the rise, ther others are pretty constant.
What are the top PhD fields?
OK, so what fields do people study. We can start with the top specific fields:
## Selecting by total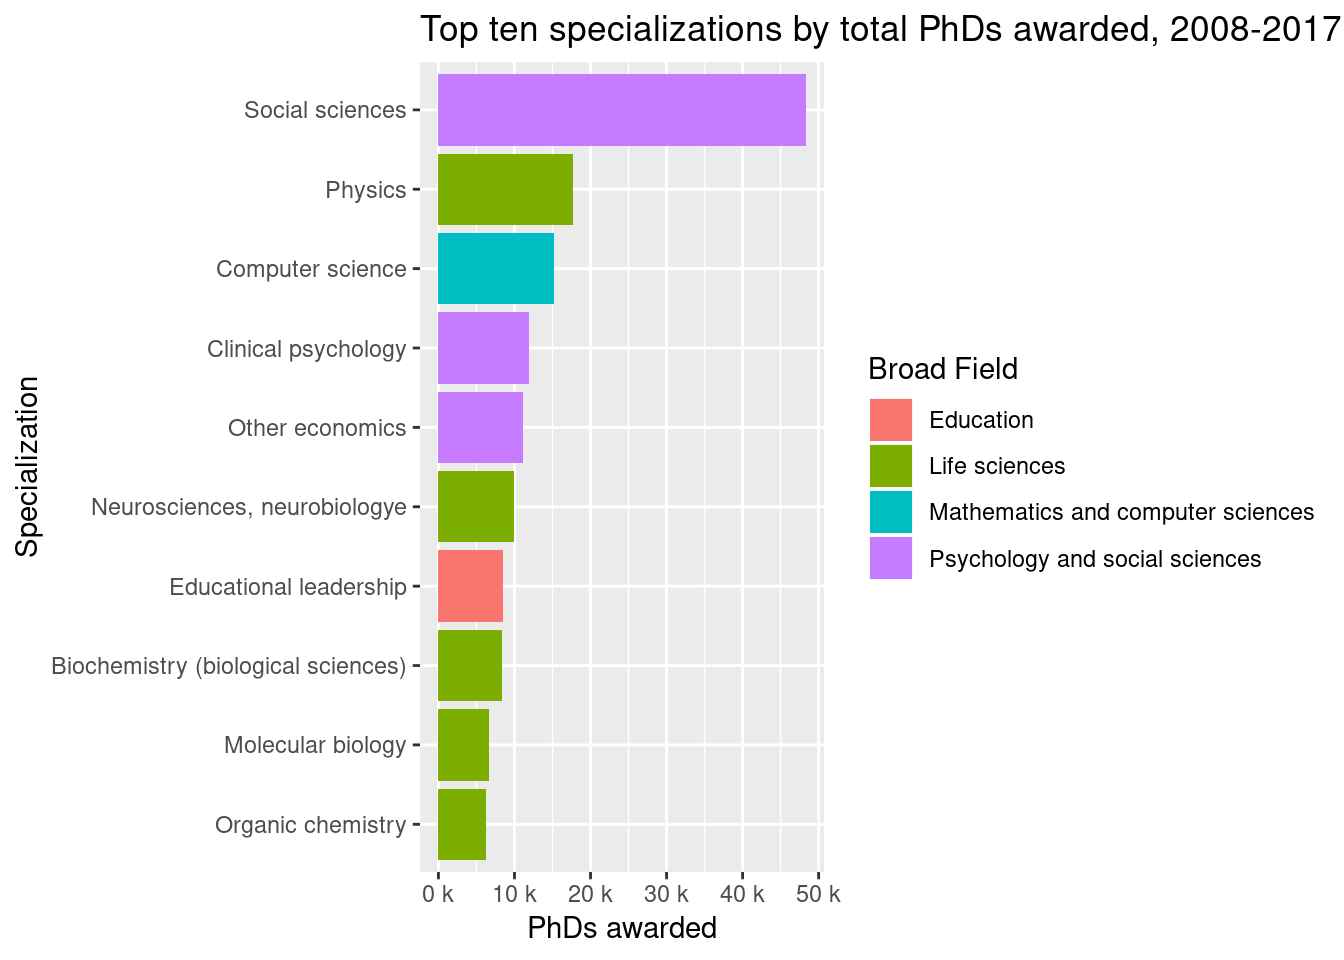
Clearly Social Science is something of an outlier here!
We could also ask what the top specific fields are per-category, say top 5?
## Selecting by total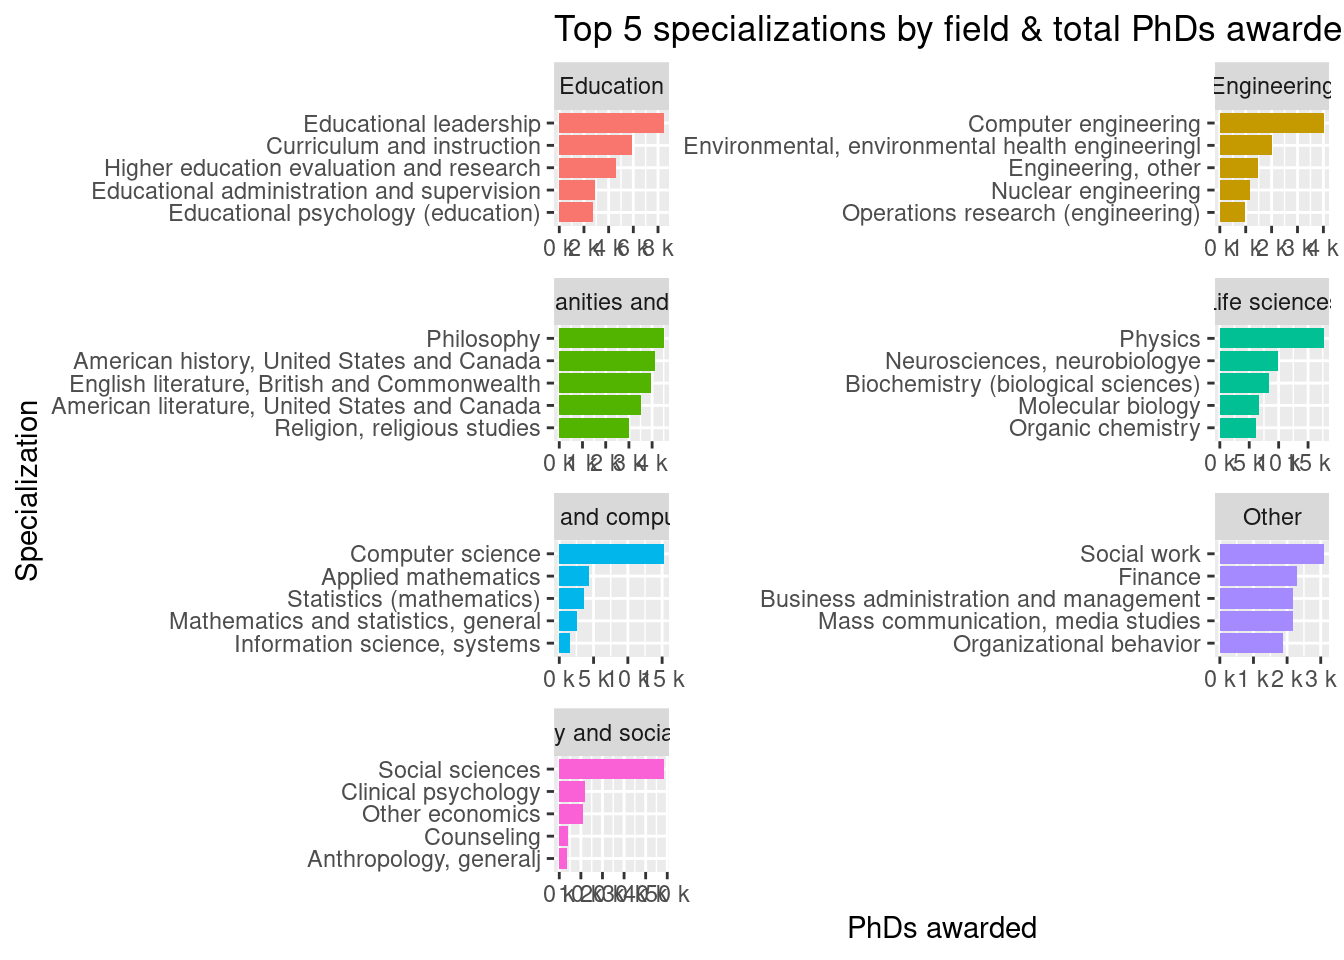
Interesting stuff!
What does the distribution of awarded PhDs look like?
I’m also interested to see the distribution of awarded PhDs within each field. Are there areas of very low study? Do certain disciplines have a very wide range of awards in different specializations?
Let’s look at the median of the 10 years, for each specialization, and visualize the distrubtion of that. We already know Social Science is super-high, so we’ll use a log-10 scale to handle that…
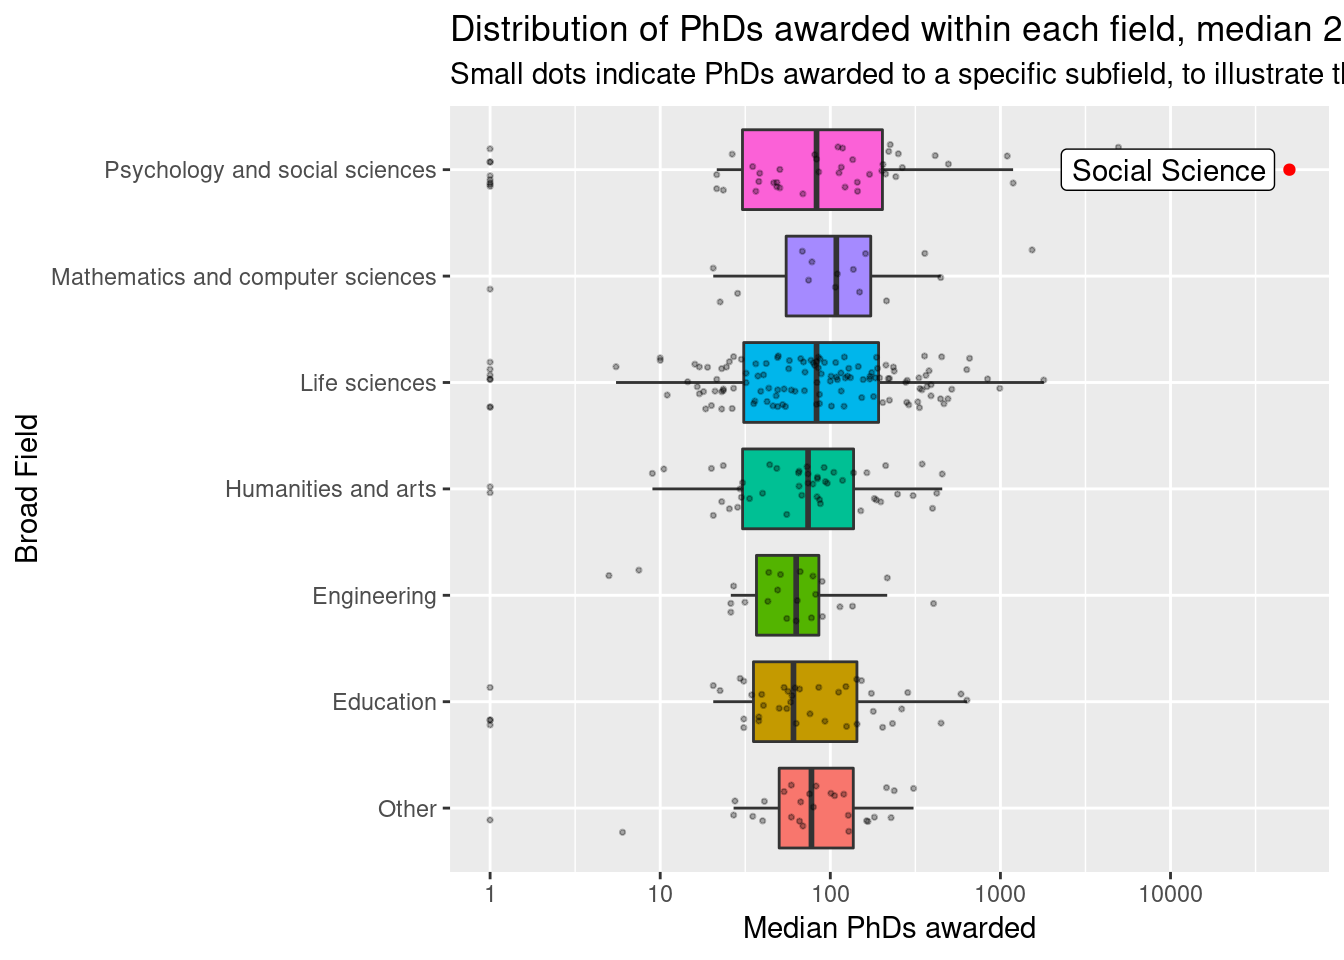
I find this pretty fascinating - the range on, say, Life Sciences or Humanities is pretty high (nearly 3 orders of magnitude), while Engineering and Mathematics seems much more even in handing out awards.
What is interesting is that every broad field except Engineering has specializations where zero PhDs were awarded in the whole 10 year period (that’s a log-10 scale remember, so 1 is really a zero). What are these under-studied areas?
| broad_field | field | median |
|---|---|---|
| Education | Business education | 0 |
| Education | English as a second or foreign language | 0 |
| Education | Trade and industrial education | 0 |
| Education | Workforce education and development | 0 |
| Humanities and arts | Dance | 0 |
| Humanities and arts | Slavic (other than Russian) | 0 |
| Life sciences | Chemical biology | 0 |
| Life sciences | Health and behavior | 0 |
| Life sciences | Health services research | 0 |
| Life sciences | Medicinal chemistryh | 0 |
| Life sciences | Molecular medicine | 0 |
| Life sciences | Natural resource and environmental policy | 0 |
| Life sciences | Wildlife biology | 0 |
| Mathematics and computer sciences | Computer and information sciences, general | 0 |
| Other | Banking/financial services | 0 |
| Psychology and social sciences | Anthropology, cultural | 0 |
| Psychology and social sciences | Anthropology, physical and biological | 0 |
| Psychology and social sciences | Applied linguistics | 0 |
| Psychology and social sciences | Cognitive neuroscience | 0 |
| Psychology and social sciences | Community psychology | 0 |
| Psychology and social sciences | Comparative psychology | 0 |
| Psychology and social sciences | Gender and women’s studies | 0 |
| Psychology and social sciences | Marriage and family therapy, counseling | 0 |
Some suggestions there for you to study, perhaps? :)
That’s it for this #TidyTuesday! I had a ton of fun, and I welcome feedback and criticism - you can find me on Mastodon if you want to chat!