Matrix Adoption So Far
It’s been 9 months since the Ansible Steering Committee ratified the vote to adopt Matrix as part of the Ansible community ecosystem. As the main proponent of this, I promised regular updates, and while I’ve done two talks earlier this year (FOSDEM and Contributor Summit), I haven’t actually written anything for wider consumption. Time to rectify that.
The State of the Chat
I’ll start with the TL;DR; and those who want the supporting evidence can read further down:
Matrix is promoting growth within the community, and is outpacing IRC as the choice of platform for users.
Since this was an argument I made in my original pitch, I’m obviously happy to be right - but I’d better back it up, lest I be accused of cherry-picking! Let’s get to it!
Note: All the data here concerns messages and reactions posted between Dec 1st 2021 and Jun 1st 2022.
Unique Users per Day
A natural place to start is our traffic levels, so let’s look at that:
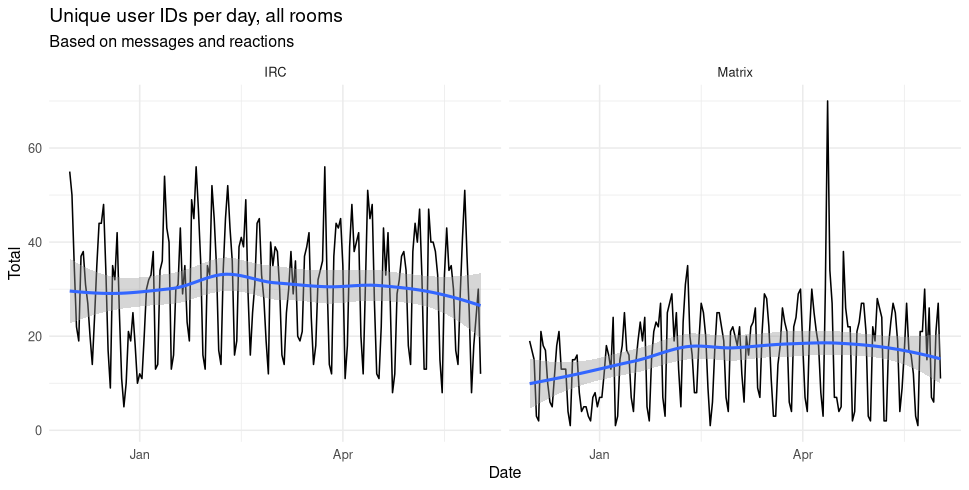
We can pick out few things here: - Chat in general is on a downward trend at the moment (but this may be seasonal). - Matrix is less down that IRC. - The huge spike on Matrix is Contributor Summit (Apr 12th). - no such spike occurs on the IRC side, suggesting new users are choosing Matrix.
This gives us an idea of traffic levels, but it’s not a great view for comparison. Let’s do IRC & Matrix as a percentage of the total, for each day:
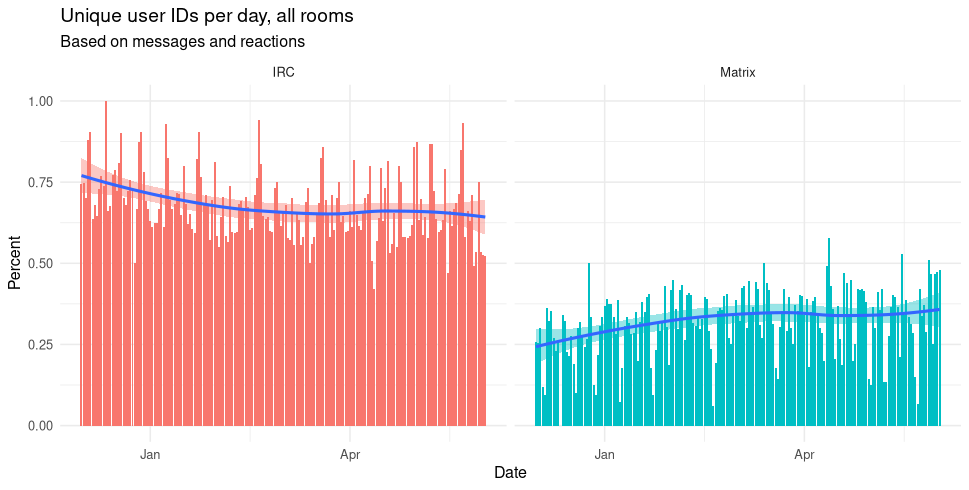
Note these are mirror-images, every date adds up to 100%. You can see that Matrix occasionally hits 50% of the daily users now, but a value like 40% is probably more reasonable. Given that we have been cautious in our advertising of Matrix, that’s quite decent.
The devil is in the detail
There is, however, some nuance to this… While our documentation correctly lists both options for communication, I would guess there are plenty of places where IRC is still the only mention (no blame here, we have a lot of content!). In particular, the User Help room (#users:ansible.com / #ansible on IRC) is especially busy and especially IRC-centric. What happens if we differentiate between that room and all the rest?
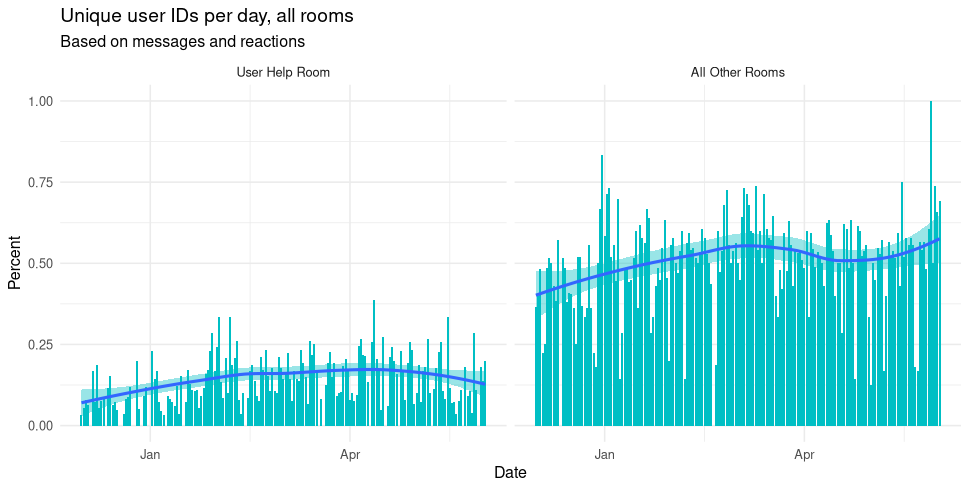
I kept only the Matrix fraction here, for brevity. You can see that while Matrix adoption in the Help room is low, the Matrix adoption in all the other rooms has been well over 50% for quite some time. I expect the slow adoption in the Help room is mostly down to the fact that culture moves more slowly in larger rooms - I expect it to catch up eventually, but it definitely confirms our caution in handling the rollout.
Growth trends
As you can see, the data is quite volatile - we see drops every weekend (which we can account for), and seasonal variation too (which we can’t without more data). Dealing with what variation we can, it is possible to get an estimate of the changing trend for each platform:
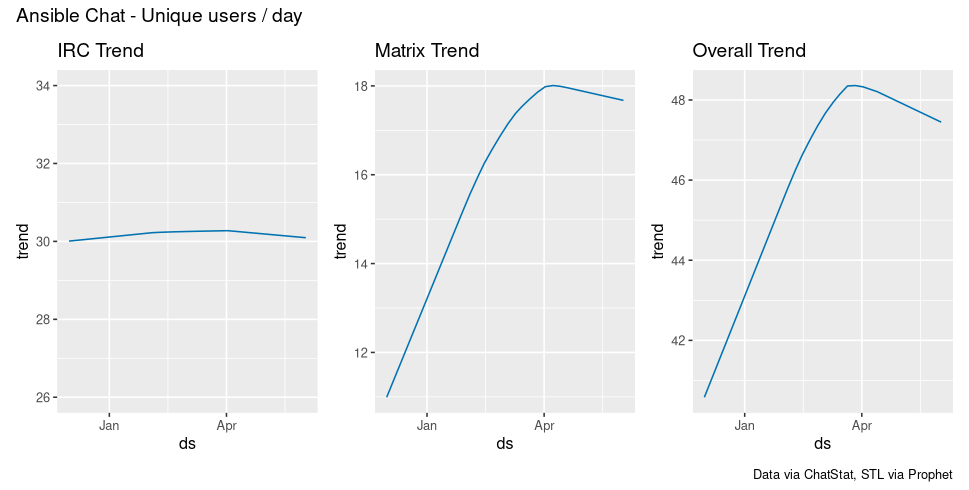
I’ve put these on a similar scale for Y (roughly 8 users/day) for ease of comparison. Two points here: - IRC has a similar shape to Matrix (both have declined recently) but it’s variation is 0.3; essentially, it’s a flatline. - Matrix, by comparison, has increased by 50% (12 -> 18) daily users over the last 6 months.
So, when we look at our overall trend (the 3rd panel, on the right), all the growth in that curve comes from Matrix. And yes, most of the decline too, for what it is worth - but that is likely seasonal (we have seen similar dips earlier in the year that were quickly reversed after holidays, etc).
Scenario modelling for trend
One last game we can play with this data is to ask “what if?” - this is
scenario forecasting. We build a model based on date vs number of unique
users, and use percentage of users on Matrix as a predictor. We can then
forecast the model, and we will look at 3 scenarios:
- Flat: Status quo, Matrix remains at 40%
- Rising: Wild increase, Matrix moves to 100% in the next 30 days
- Drop: Stop using Matrix, drops to 0% in the next 30 days
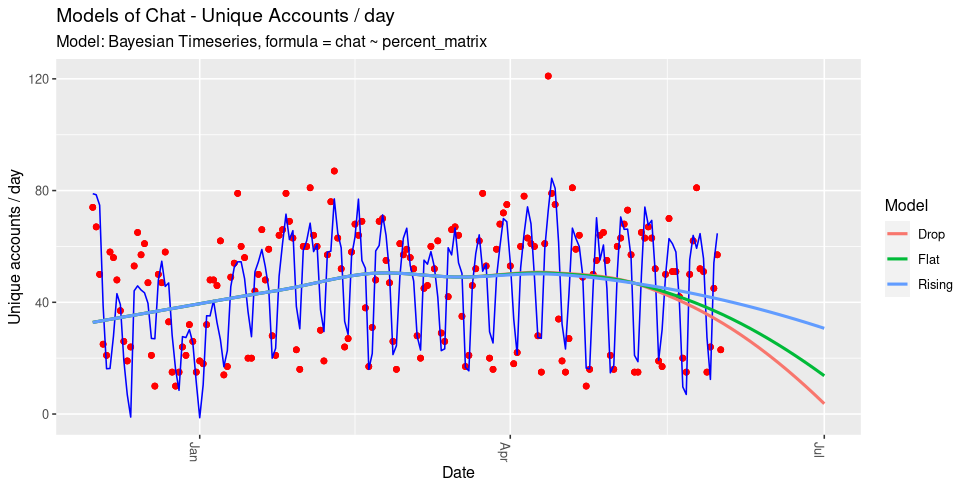
The red dots are the raw data, the dark-blue line is the model fit (just to show it’s a decent enough model), and then the non-seasonal component of each model is plotted on top (which is identical for the historical data, but then diverges as we move into the future).
You can immediately see the model picking up on the recent dip - time-series models tend to treat recent data more strongly than older data, so this is expected… so don’t take the downward turn too badly!
The big result, though, is looking at the three model lines, where you see a clear ranking - the higher the proportion of Matrix users, the higher the model forecasts the number of daily users. So again, we see support for my statement that Matrix is doing well - it’s growing, where IRC is not.
Conclusion
I’ve used users-per-day for this analysis, but the same results hold if you use messages-per-day. I suggest that adopting Matrix is making our community more accessible, and I think the trends we see here will continue. So, it’s not great leap that I also think we’d be wise to start basing more of our communcations policy on Matrix.