Community Survey Data Part 1 - Surveys are Hard
OK, 6 months is far too long without a post. I’m sorry, please forgive me. But I’m making up for it with a super special set of three posts, deep-diving into the survey data from our lovely Ansible contributors!
Every 3 months we have a Contributor Summit which is awesome organised by Cybette, and then I send out a contributor survey. The next two posts will actually look at the data in detail, but first buckle up, because it’s rant time!
Surveys are hard
When I started working in communities, I did not appreciate this. I rattled off a bunch of questions, got answers, was happy. But the truth is, there’s a bunch of hidden dangers in surveys, so we’re going to start by examining a few, and how I structure our survey to cope.
- Question design - this one is on me. It turns out that asking your folks hypothetical questions is a bad idea (e.g. “how should we allocate our time”, or “what issues would you fix”). They don’t know your constraints, and will generally ask for unrealistic things, making the results useless. Stick to asking for their experiences, and you make the decisions. Don’t abdicate responsibility.
- More design - also, don’t ask two questions at once. Sounds obvious, but it can be hard to catch in practice.
- Wording - turns out language is hard too. Every survey I’ve done (not an exaggeration) has had at least one question that could be misinterpreted in some way. That leads to people answering a different question than you thought, and again the results become a mess. These days I catch these by testing the survey on a focus group first.
- Survivor bias - we’ve
actually got this twice:
- People who came to the events vs those who didn’t. If we only survey those who came, we can’t account for the reasons of those who didn’t.
- Contributors vs other community members. We ask about things like blockers
to contributing, but we might not get a clear picture if we are missing
those who could have been contributors but got turned away.
I handle this in two ways. For (1) we send out the survey to attendees and non-attendees alike, with two questions sets and some logic depending on whether you attended or not. So we can try to get representative results for the events. For (2) I include a couple of demographic questions (time in the community, version of Ansible) that we already have some data for - that means I can use survey weighting if I need to. 4. Analysis is hard - I’m looking at you, Likert scales. But we’ll get to that.
Hopefully this helps to understand why the survey is the way it is, even when some questions seem unrelated (those are the weighting questions). Perhaps it’ll make it less infuriating to fill in? :)
Why so often?
One rule of thumb in surveys is to not bore people - asking the same stuff repeatedly gets boring, and responses tend to fall off. However, I’m bootstrapping a dataset here - I don’t want to have to wait multiple years before I can start to work with the data. So instead of a big yearly survey, I’ve gone for a focused quarterly one - there’s only ~10 questions to answer, so it only takes a few minutes.
As a bonus, we can show that communities don’t evolve too fast. In the models I’m going to show you later, I do account for the survey a response came from, and it makes very little difference. That matches my expectations - I expect culture shifts to take years, not months, but it means I can’t use data from multiple years ago without care.
Analysis is hard too
The next two posts will do some serious analysis, but in both posts we’re concerned with the final question on the survey. We ask
“On a scale of 1 to 5, how would you rate your experience of contributing to Ansible recently?”
This is a Likert scale, and it is a subtle and terrible foe. Let’s have a look at our opponent, shall we:
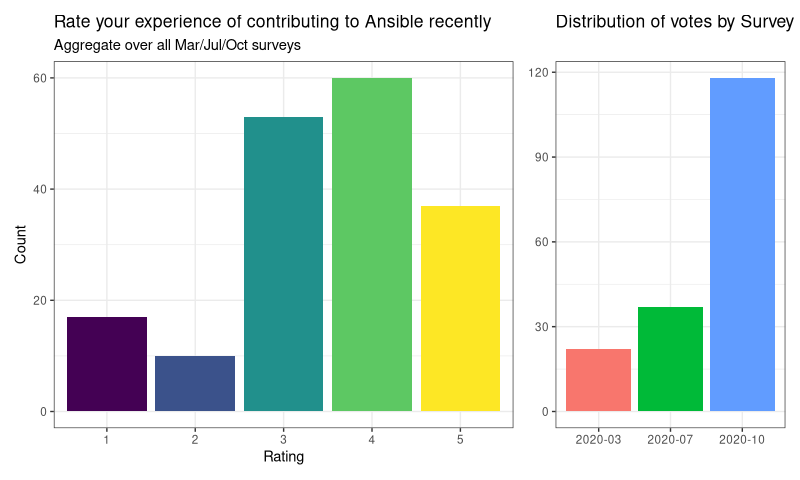
OK, so right away we can see people are generally happy, and that October was a bumper month for survey responses (yay, AnsibleFest!). We’re going to break down the data into some subgroups and do some comparisons, but first we need to deal with an ugly truth.
Likert scales are easy to abuse, especially when you formulate them (as I have) with numbers (1 - 5, here). They are not numbers, not even close, and that’s a problem because there is a desire to want to do things like take an average (mean) of them.
In truth, they represent a scale of something subjective - how much you agree with something, or like something. There is no guarantee that (a) how I perceive that scale is the same as how you perceive it, and (b) that the gaps are equal. It’s the combination that is the kicker - it could take me a little to move from 3 -> 4, but a lot to move from 4 -> 5, but you might just be the sort of person that never uses 1. Because the gaps between the levels are not the same, nor are the differences even the same from person to person, we can’t treat them as numbers. As a wise person put it to me:
The average of OK and Good is not OK-and-a-half, and that’s true even if you replace the words with “3” and “4”.