Collections - The Backlog View
In this post, I’m going to explore some of the community data for the last few years, and show why that suggests that drastic action is needed (and as we now know, that action is Collections).
To some degree, this is just retrospective justification - we are already doing Collections. But I wanted to try and show what trajectory the community was on, if we did nothing. Honestly though, I also wanted to practice some of my forecasting techniques… :)
What’s wrong with the old way?
I do want to address one thing before we start. As we’ll see further down, the current structure of a single monolithic repo isn’t working - but then one possible argument here that needs addressing is:
Why don’t we do it the old way? Have all the modules in an separate
ansible-modules-extrarepo?
It’s a fair question, but to try and help, I’ve specifically restricted my
attention to PRs which touch /lib/ansible/(modules|module_utils)/* - and
that’s what would go into a new ansible-modules-extra repo. So the
“unsustainability” exists within the modules themselves, not ansible/ansible,
and moving that to a single repo won’t help.
I’ll say more about my thoughts on the many-small-repos plan in the conclusions at the end…
The dataset
OK, so we’re going to consider this from a workload angle. JP Mens did a great job of talking about this in his 2019 blog post, where he spoke about how getting things merged was taking longer and longer.
That’s a death-knell to a community - ignoring contributors means they don’t come back. And we know that there’s a limited pool of people who can merge things. So we’ll look to the backlog of PRs as a measure of workload.
We’ll grab all the Pull Request data from GitHub for ansible/ansible, and
apply filters to it:
- as above, we’ll filter on
/lib/ansible/(modules|module_utils)/*. That’s because our focus is the community, and the discussions has largely been around the “batteries-included” model of Ansible, and the vast majority of community contribution happens in those two directories. - We’ll also filter by date. The current structure of
ansible/ansiblewas created at the end of 2016, when theansible-modules-extrarepo was merged in, so we’ll filter ondate >= 2017-01-01. Furthermore, Collections has been known about for a while now, and it’s effect can already be seen in the core repo, as people migrate to other repos. So we’ll also pick a date to cut-off at too - I’ve gone withdate < 2019-09-01since AnsibleFest Atlanta was in Sep ’19. - Lastly, filter out
backportlabelled PRs to ensure we have real contributions and not duplicates.
In all, something like this (this is pseudocode, but it’s very close…):
prs_1 <- get_prs_by_filepath('lib/ansible/modules')
prs_2 <- get_prs_by_filepath('lib/ansible/module_utils')
prs <- bind_rows(prs_1,prs_2) %>%
  filter(date < as.Date('2019-09-01')) %>%
  filter(date >= as.Date('2017-01-01')) %>%
  filter(label != 'backport')
Before we filter it, though, let’s just look at the raw opened and closed
issues over time, to check those dates:
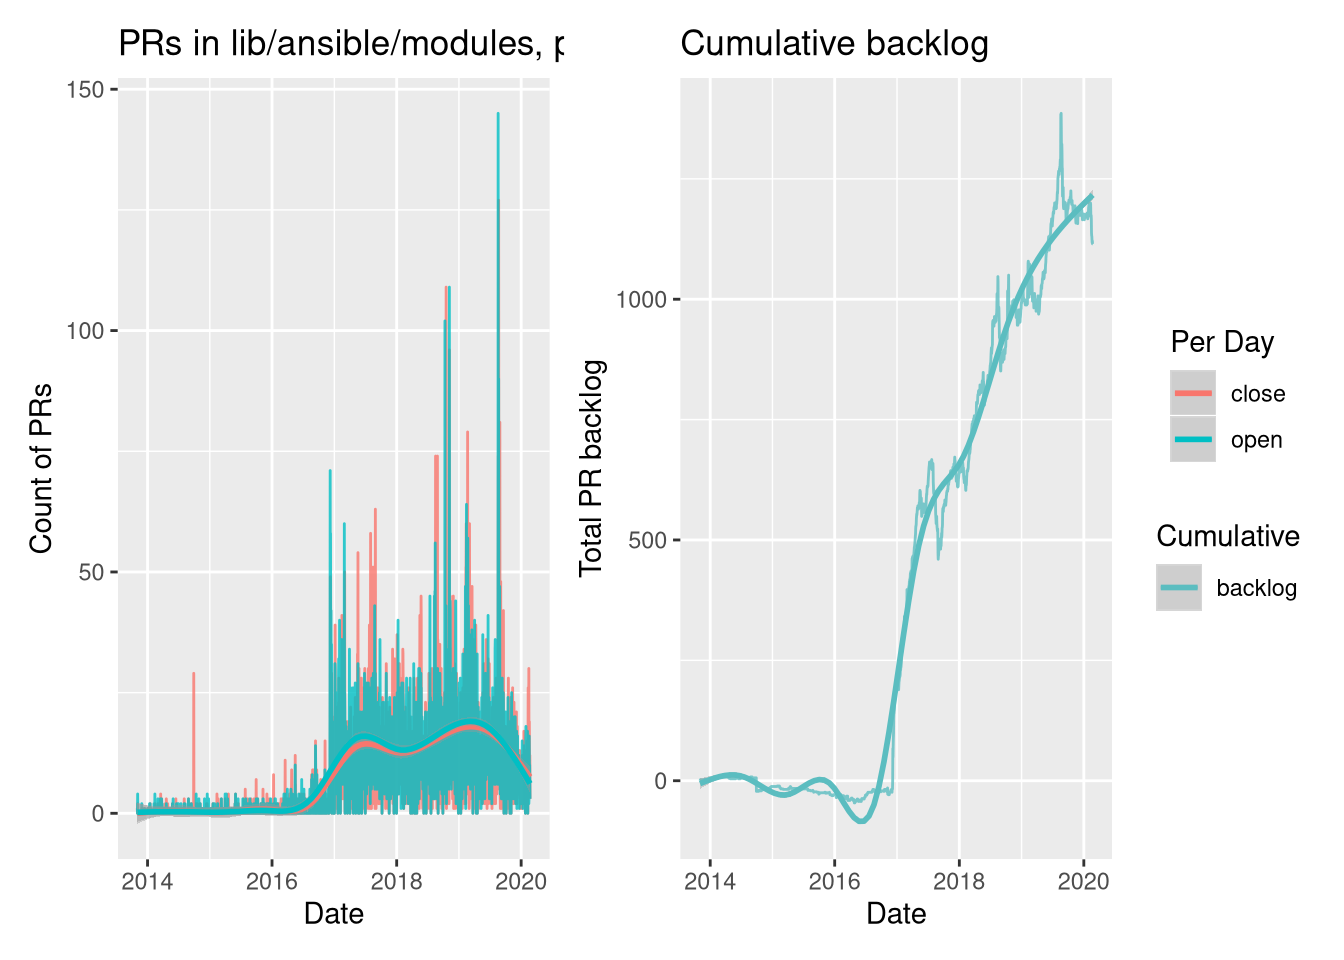
Straightaway, we see that the filters look right - a big step-change from 2017 on-wards, and a tail-off at the end of 2019. Let’s now apply our date filters (the path and backlog filters have already been included above) and re-plot:
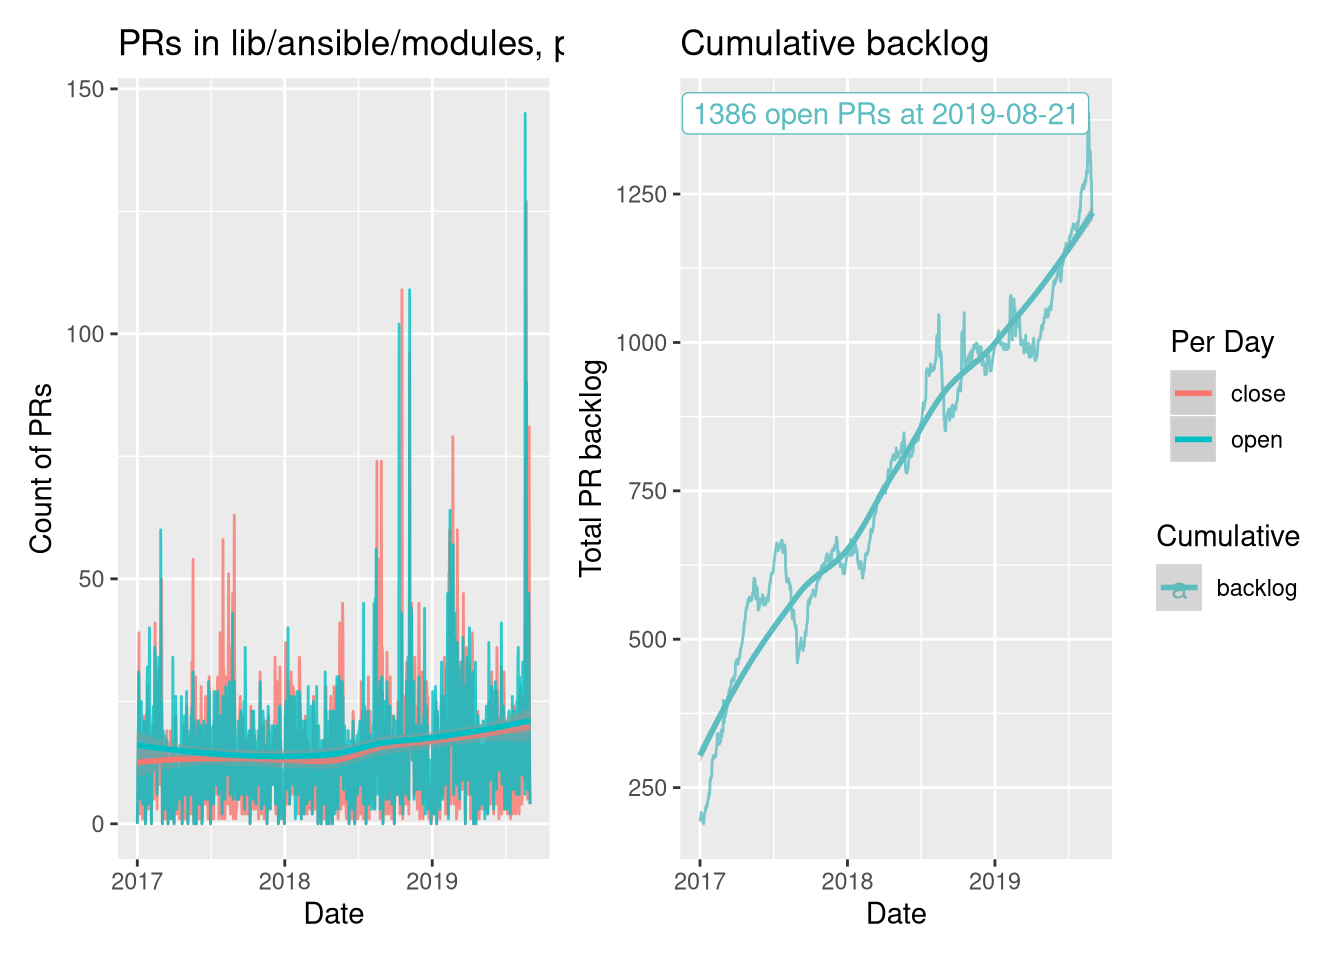
Now the scale of the problem is clear. Over the ~2 year period, the closed rate
is consistently below the opened rate (see fitted lines), meaning the backlog
is continually growing. If we run a cumulative sum over open - close (which is
the backlog change, so cumulative is the backlog itself), then we can see just
how large it’s become. That spike in August ’19 is 1386
PRs. That’s just enormous, no wonder people are noticing!
Where were we going?
As I mentioned above, I’m itching to practice my forecasting! Let’s try to see where the community was headed….
Here’s the problem, though. The raw open & closed data is extremely hard to
work with - it’s noisy, has frequent zeroes, large outliers, and odd
seasonality. It’s not fun to work with.
Luckily, the backlog is not - it resembles a “random walk with drift” which
is well studied in statistics, and we can make it a stationary time series by
differencing it (i.e where we subtract yesterday’s value from today, and so
on). That gives us the daily change in the backlog, which must be the same as
open - closed for each day. So, let’s forecast!
Backlog Forecasts
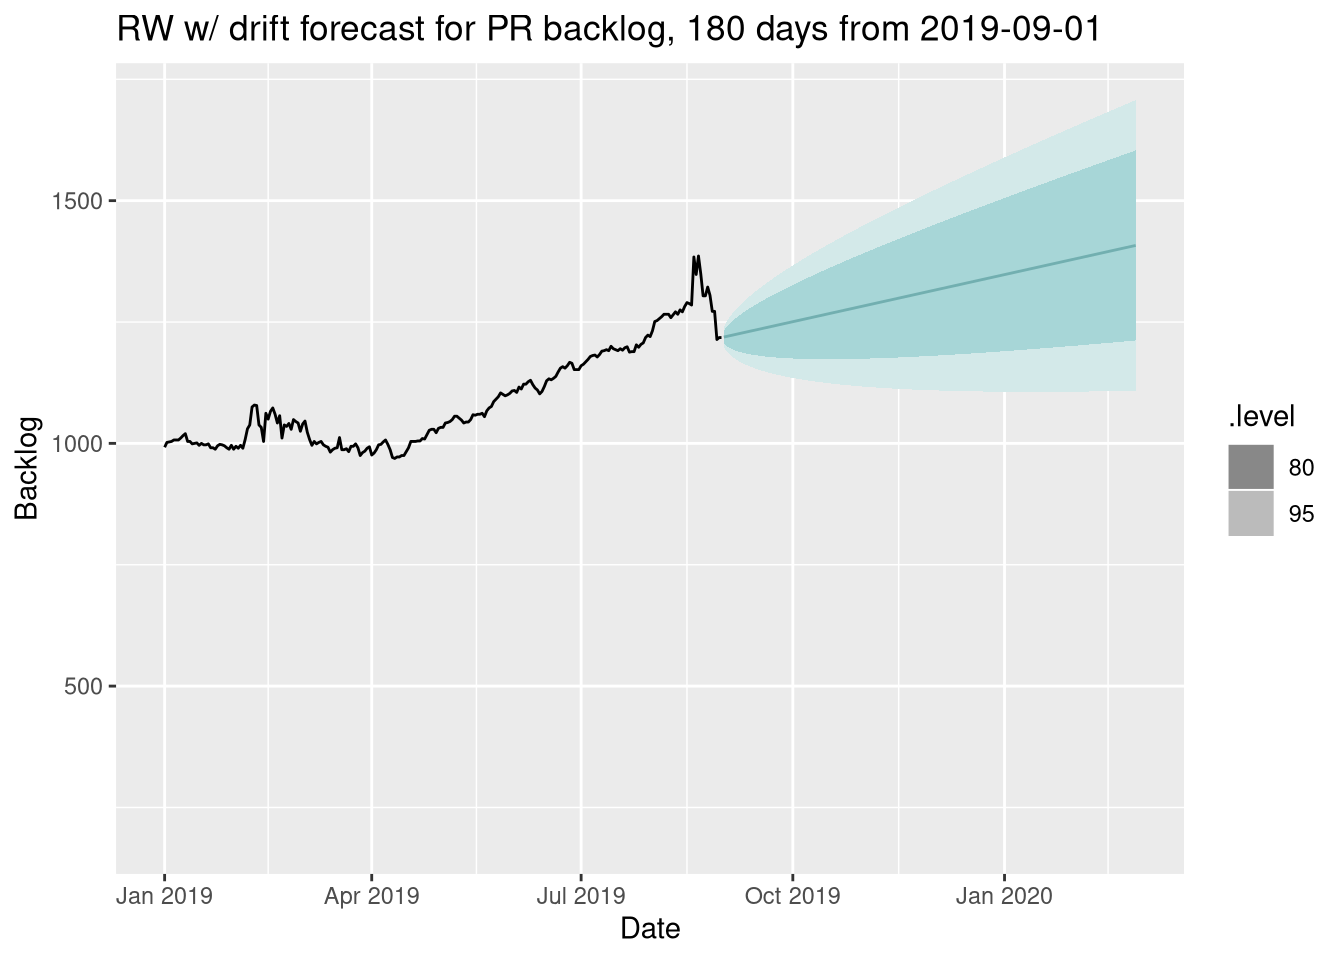
The simplest forecasts are naive ones - forecasting the mean of the data, the last value, etc. The most appropriate naive method here would be the Drift method, as mentioned above, and it looks like this:
We can go a little further though - a Drift model is a special case of an ARIMA model, so let’s go ahead and let R fit an ARIMA model for us:
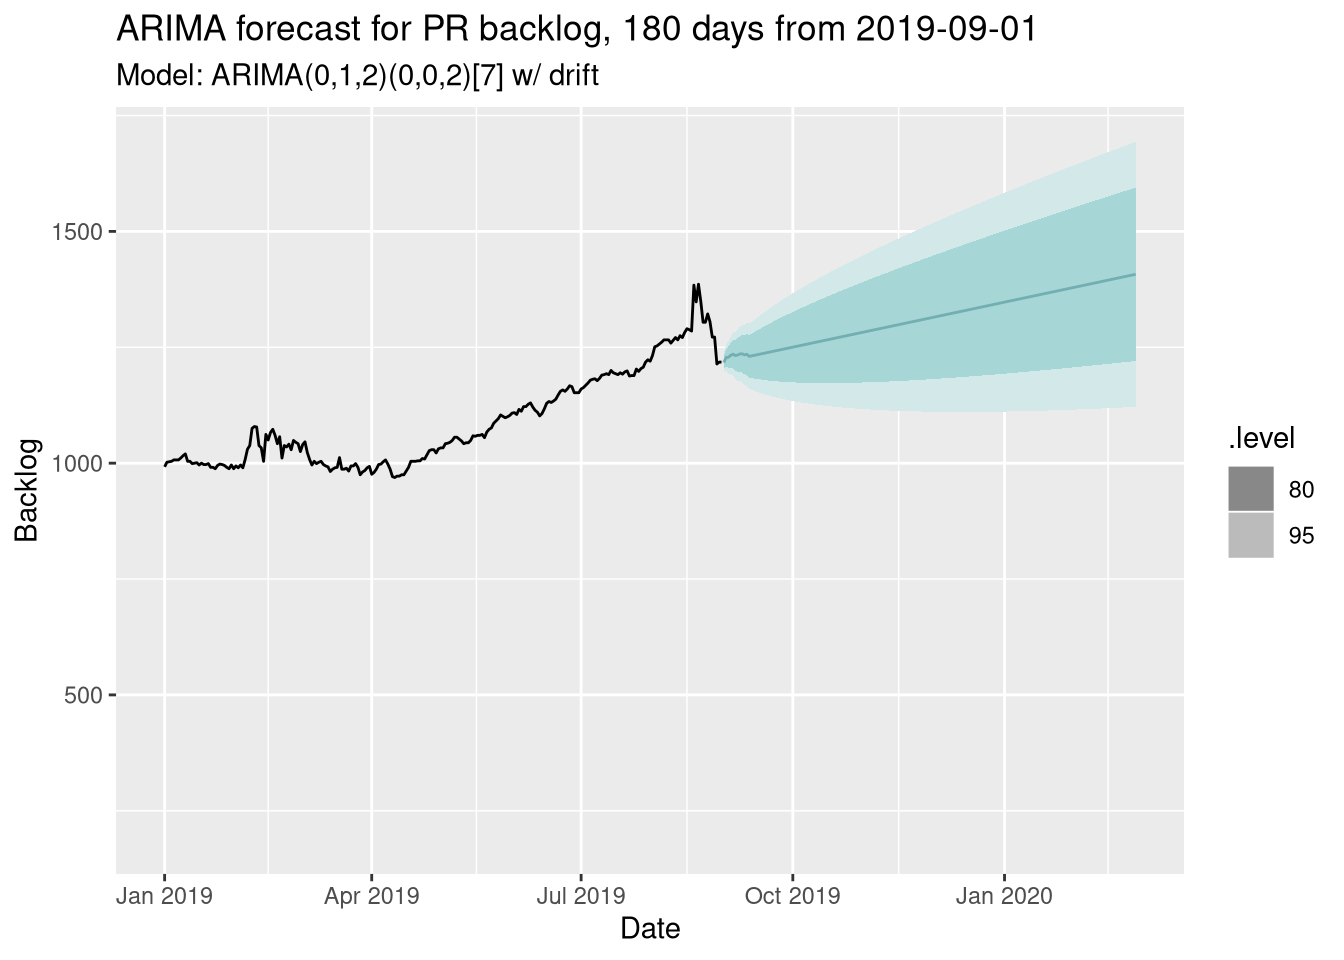
Very, very similar! That’s not surprising, as we were fairly sure a random walk fits the underlying process. However, we can do more with ARIMA though, and we’ll come back to that in a moment…
Let’s also do an ETS model - again, it’s a very similar picture:
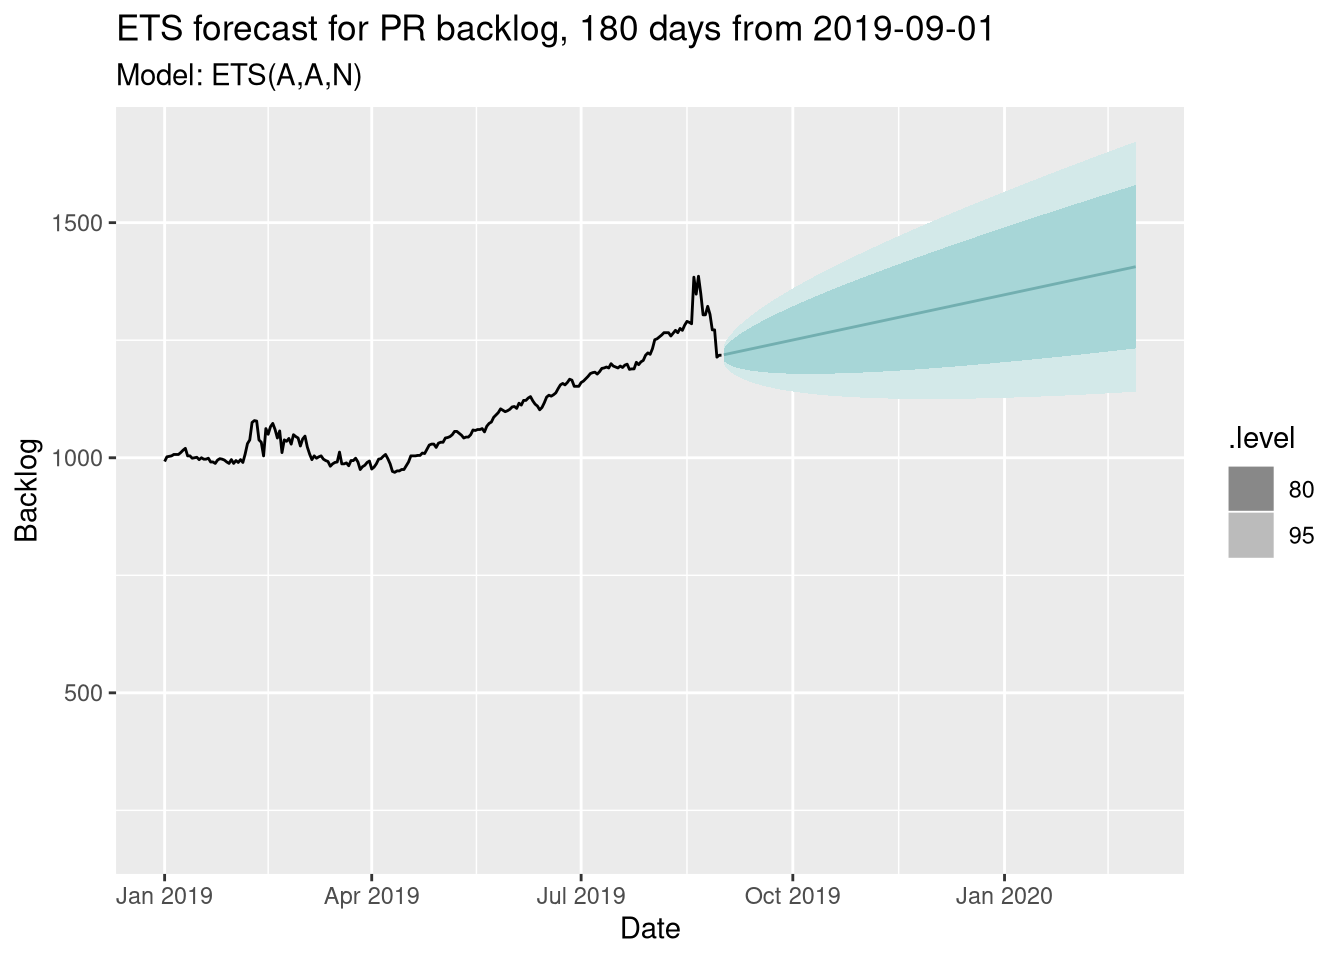
So 3 very different approaches all give a very similar picture - that we would see sustained growth in the backlog into 2020, maybe 1500 open PRs by today. However, we’ve missed something…
Predictors
ARIMA models can use other variables to help us explain the variation in the data. One easy-to-understand example is date-based effects - does the day of the week, or the month of the year, have an impact on the backlog?
Date-based effects
It makes sense that the change in the backlog might be affected by day-of-the-week - many people work on Ansible for the $day-job, and thus the backlog might spike over the weekend…
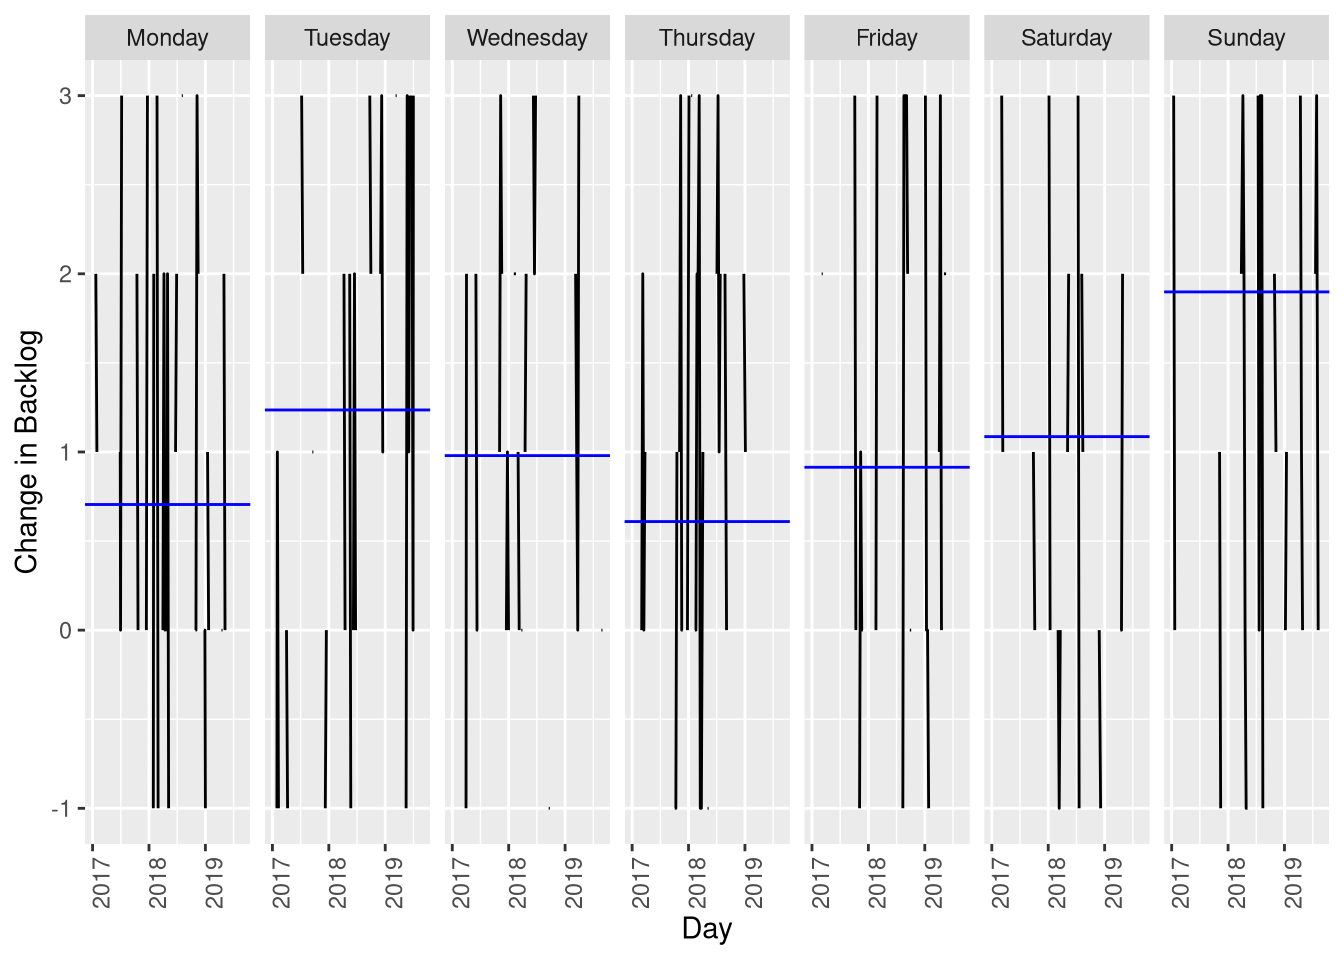
Ignore the black lines, focus on the blue - these are the mean change in the backlog for each day of the week. There’s only a difference of 2 between Thursday and Sunday. So it’s there, but it’s not huge (actually the ARIMA model above picks up weak 7-day seasonality, as denoted by the [7] in the description above). So this is already handled for us.
What about holidays? One way we might see this is to total the diffs for each month, Christmas is in Dec, Easter is around March, etc:
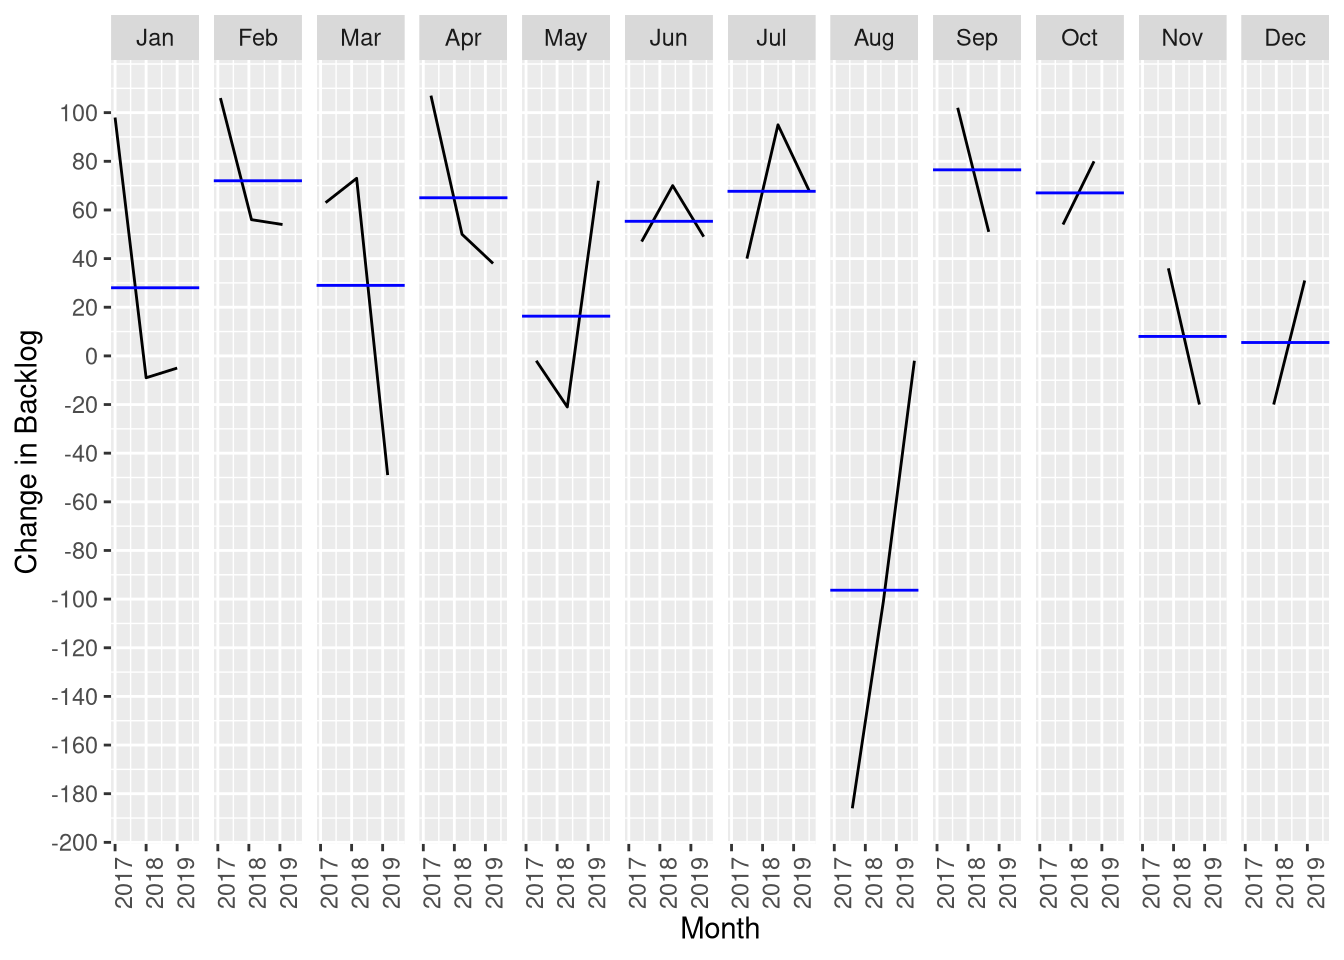
The data here is sketchy, we only have 2-3 data points for each month (i.e. the total amount of change in the backlog for a whole month, 2017-2019). Still, it looks relevant, August is very busy (big drop in the backlog) while Feb-Apr it rises. The overall trend for the backlog is ~27 more PRs / month, so actually months like November, December, etc, are doing well.
So, we’ll include “month” as a predictor. Now, something harder…
Maintainers
In the above forecasts we’re assuming that the underlying mechanics of how the backlog change itself changes doesn’t alter with time - and I’m not sure that’s true. Let me unpack that dense sentence a little :)
Most notably, the backlog change will be affected number of closed PRs,
and that is affected by how many people are able to merge code, so if the daily
increase in closed PRs doesn’t keep up (it has a slight positive trend, ~0.3 /
month), the backlog will start to grow exponentially. We already know that the
tooling and process around ansibot and so on which unpins the current
structure is struggling. Are we sure that closed will continue to grow at it’s
current rate? I’m not convinced.
(Aside: My gut feeling is that this is really about number of people reviewing &
merging code. However, getting data on this isn’t easy. We use “ansibot” to do
the actual merges, so the “Merged By” field isn’t useful. Parsing the comments
for “shipit” on every PR (all 20k+ of them) is too big a task. So, we’ll stick
to modelling changes in the closed variable itself, even if that feels a bit
approximate.)
We can use the number of closed PRs as a predictor in our ARIMA model, and then forecast using different rates of closed PRs. I don’t think the rate is going to increase (if we could make it do that, we already would have), so we’ll restrict our attention to ways in which the rate of closing PRs could decrease.
Here’s the various curves we’ll try out - these are assumptions about what the total number of closed PRs might look like in the future. We need this as an input to our backlog forecast, since it’s going to use closed PRs as a predictor. The “pecentages” refer to a percentage change in today’s rate-of-closing-PRs.
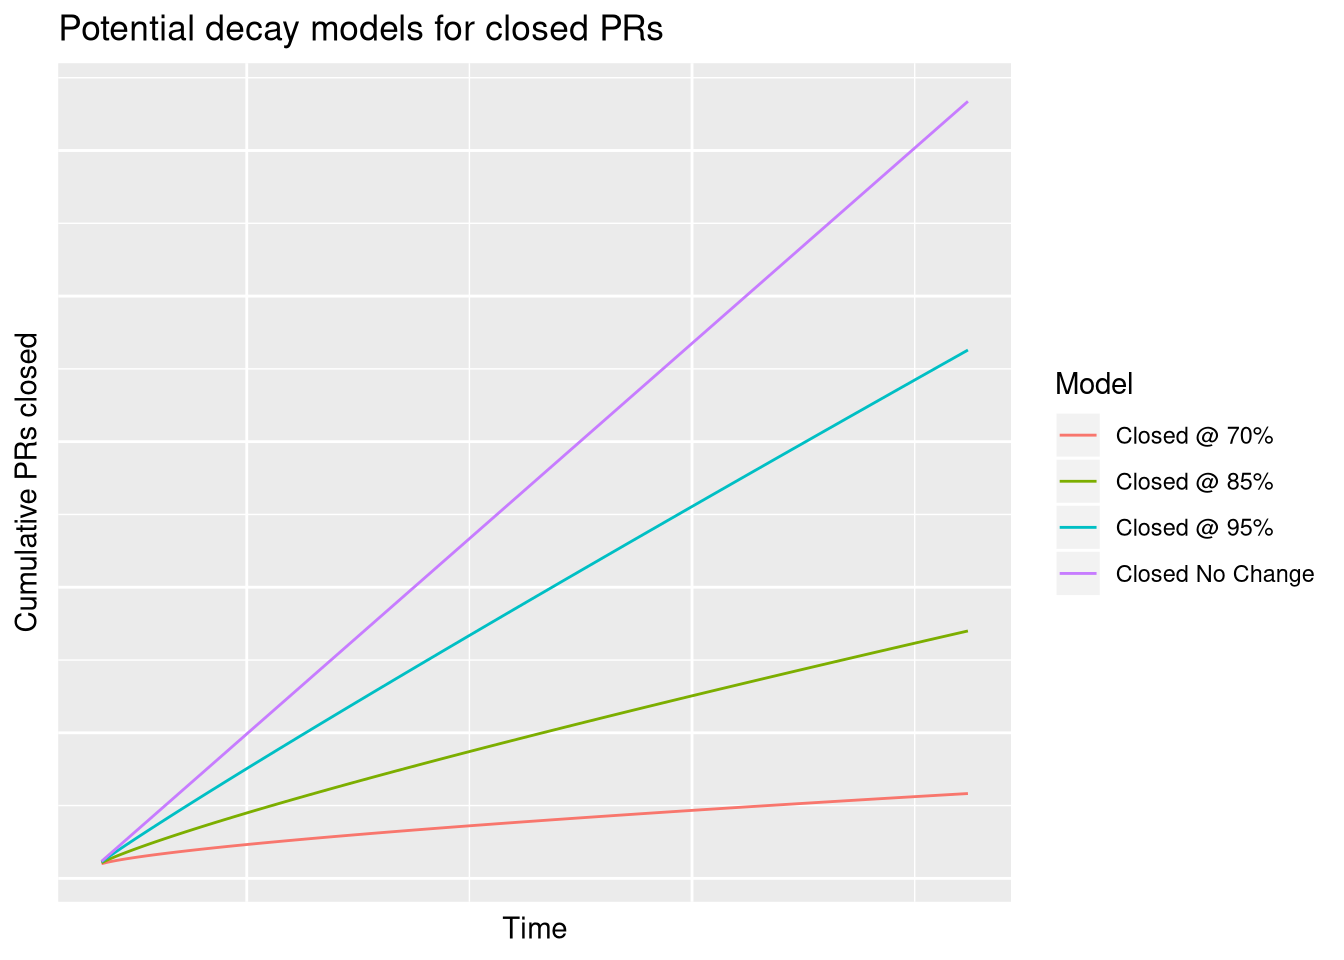
The idea is that over time, less PRs are getting closed, so the cumulative number of closed PRs decays away.
Putting it all together
So, here we go. We’ll produce 4 plots for 4 different values of the rate of closing PRs - let’s do 1 (no change), and 0.95, 0.85, 0.7 for a modest,
medium, and strong decline in how we keep up into the future - and we’ll add out
month predictor too:
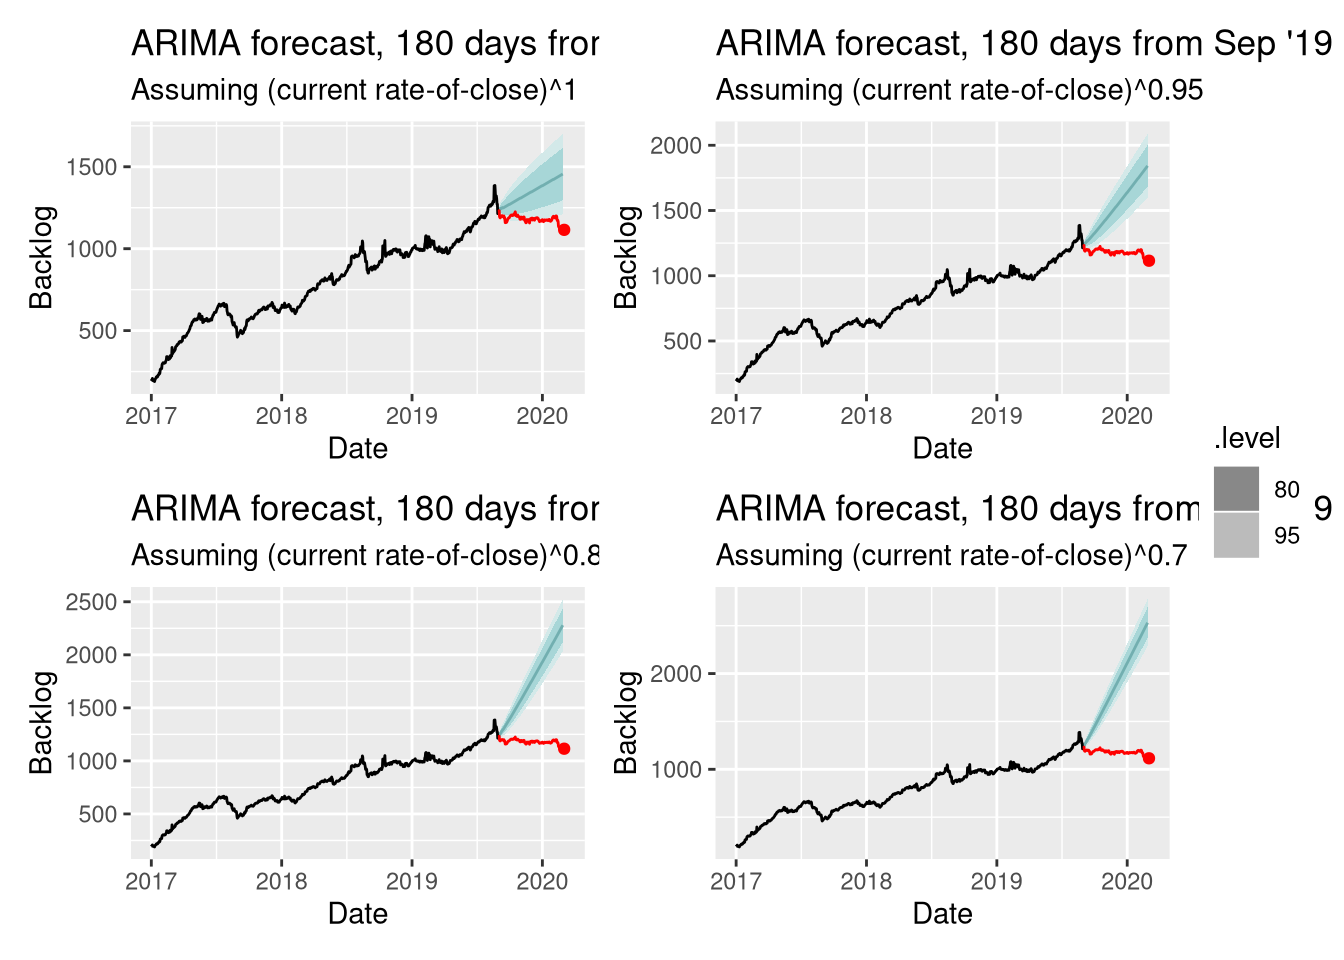
Just for fun, I’ve added back in the data we filtered out at the start, from Sep 2019 on-wards. That way you can see what actually happened - we announced Collections, and started preparing for the move of content to new repos. The back stopped increasing almost overnight, and has been slightly decreasing ever since.
Hopefully, the impact of this is now clear - even the best forecast (no change
in closed PRs) for our backlog (assuming opened PRs keep increasing) would have
us at ~1500 PRs to /lib/ansible/modules by now. Even with a minor decline in
our ability to close PRs, it’s more like 2000, and getting rapidly worse as we
move through 2020. Even if the closed-PR rate drops by 5%, the cumulative effect
puts us at a 3000 PR backlog by the end of 2020 (2585 - 3397 @ 95% CI).
Conclusions
If you got this far, well done :)
Hopefully, that helps you to understand why we had to do this. It was already plain to core members that the amount of PRs was unsustainable in the current format - but being able to visualise this way can help to spread that message. That we are at ~1100 module PRs today show that we’ve already had an impact.
The hope is that moving the backlog out to multiple repos and giving more power
to individual groups is the way to increase that close rate. This is something
of a experiment - we have a “control” group in community.general which will
(to all intents and purposes) look a lot like today’s repo, and likely suffer
similar problems. But we’ll also have a whole ton of other repos who can try
things out, see what works, and what doesn’t. Part of my job as the community
data scientist is to track that, and help get those insights back to
community.general. For certain, I’ll be tracking that, and keeping you all
informed :)
There’s plenty more on the why of Collections, if you haven’t already read up on it - the Restructuring Ansible blog post is a good place to start!