Tracking the evolution of "community.general"
Hello! It’s been a while. I’d like to blame Covid19 for some of my absence, but in reality, I keep forgetting. Sorry! Still, while the best time for a new post might have been a month or two ago, the second-best time is now, yes? Good.
Today we’re going to talk about “community.general” - the Collection that was created to hold all the content migrating from Ansible core that didn’t have homes to go to. If we’re going to avoid the chaotic tailspin of thousands of open PRs that happened there, we need to know what’s going on - an early-warning system, if you like.
If you don’t want to read my waffle, and just want to jump to the live dashboard, go here:
https://stats.eng.ansible.com/~/admin/community.general.issues.html
Otherwise, carry on for my thinking :)
Why tests matter, even in data
I want to start with an errata, though. In the recently-started Ansible
Community newsletter, The Bullhorn, Issue
2 I published the first of a
few graphs I want to use to monitor community.general. The problem is, that
graph is flat-out wrong. Mea culpa, entirely.
Worse, I absolutely should have caught it. I was suspicious of the result - for a new repo, with spin-up PRs for testing CI and bots going on, and issues migrating over from core to not have a notice upward trend in open Issues was… odd. So I spent ages looking at the code before concluding the code was right. It really was flat.
What I missed was that it was still hooked up to my test repo. The code was
right, but the source data was wrong! Once I switch to looking at
community.general, the result I was expecting popped up. So yes, folks, test
your data :)
What we care about in “community.general”
I think I need to step back, and talk about what we want to see from
community.general. We should always consider our data analysis from the
question-first view, not data-first.
For me, the key thing is that it remains under control. So what causes it to go out of control? Broadly, it’s not closing things in a timely fashion. But that can have multiple causes:
- More Issues than the maintainers can cope with
- Maintainers burning out and thus not as many reviews get done
- Lots of Issues to a specific module, overwhelming that subset of maintainers
The first one is the main risk, but the latter two are worth watching. How can we track this?
Too many issues
Fundamentally, this is about the backlog - the number of open issues at any given time. If there is a sustained positive increase in the backlog, then we will be back at square one.

Time series of the backlog
We can, of course, plot a time-series of the backlog itself (and we will, else people will just ask for it anyway) - and we could forecast that forward, as I did for Ansible core in my last post. But here, I think there’s a better option.
If we difference the backlog - that is, we look at the change in the backlog
per unit-time - then what we’re really doing is tallying the opened and
closed issues in each block, and calculating opened - closed. That’s the
backlog change. We can regard this as a distribution (that is, each value is a
sample from a range of possible changes in the backlog), and it should be a
Normal distribution too - values around the mean are more likely than extreme
ones, but any value is possible.

Now, if we have a distribution, we can test it formally - that is we can ask if the mean of this distribution is significantly different from 0. If it is, we have evidence of a trend in the backlog (e.g. a mean of 5 would suggest the backlog is growing by 5 extra open issues per time-period). If not, we conclude that the backlog is not trending in some way.
This is a solid way of dealing with outliers (which will happen, e.g. when we finally flip the switch to mass-move issues from Ansible core). I think it’s going to be Gundalow’s key value for where we’re at.
Aside - it’s somewhat questionable if you can regard a time-series as independent data points, as it ignores auto-correlations in the series. But here I think it’s OK - I don’t see that how many issues were raised last week is going to affect how many issues will be raised this week…
Burnout
OK, we can see if the overall number of issues is rising. But what about reviews
themselves? It’s time to turn to my favourite tool - survival
analysis.
We can take a look at the time-to-close for the repo, and also the
time-to-first-comment (excluding self-replies and bots).

I’m still fiddling with this - right now I’m plotting recent issues (blue) versus older issues (red) to see if the newer issues have different statistics. In time, I’ll be recording these values regularly, which will mean we can add a trend graph for them as well as a “current” view.
In any case, what we can take away from these is that if these times start to show an upward trend, we should look into why.
Subset overload
The final piece of the puzzle relates to overwhelming a subset of the repo - if,
for example, the postgres module were to be deluged in issues, the maintainers
of that specific module might not be able to keep up. We need to try and spot
modules that consume a large proportion of the workload.
I’m still working on this one, but as a very rough first pass, we can do a table:
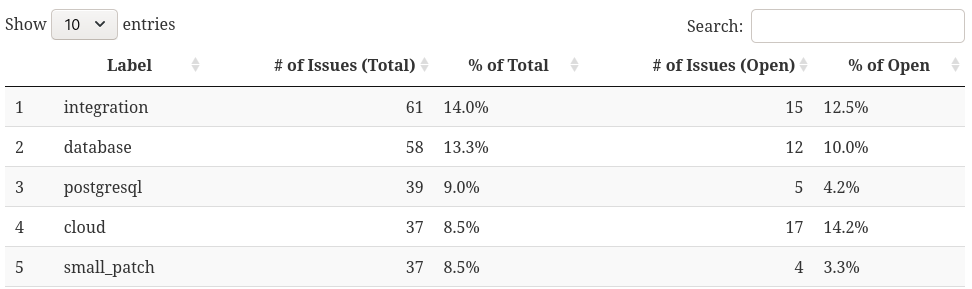
We can list any given label’s issues as a proportion of both the total issues (in, say, the last year) regardless of state, and also as a proportion of the open issues only. The former tells us how popular/big the module is overall, the latter tells us about how much it’s contributing to the backlog.
One of the tools we’ve gained by moving to Collections in general is the ability to relocate content - and we should use it. So if this table (and future tooling here) suggests one or more modules are taking up a disproportionate amount of “airspace” in the repo, we can look to migrating it to a new Collection of it’s own. That’s something we just couldn’t do when it was all in Ansible core.
Conclusions
Again, if you want to look at the recent data, it’s here:
https://stats.eng.ansible.com/~/admin/community.general.issues.html#backlog-change-over-time
Hopefully this tooling can get us to a point where we’re confident that
community.general won’t repeat the mistakes of the past - we’ll known when
it’s sliding, and we’ll hopefully know which action to take to alter the path.
Until next time!